
Page 131 - 2021 Issue 2
P. 131
Profile’s Stock Exchange Handbook: 2021 – Issue 2 JSE – FAI
brands. The Leading brands are further categorised as Quick Service, Fast
Fairvest Property Holdings Ltd. Casual and Casual Dining.
FAI SECTOR: ConsDisr—Travel&Leis—Travel&Leis—Resturants&Bars
ISIN: ZAE000203808 SHORT: FAIRVEST CODE: FVT NUMBER OF EMPLOYEES: 4 465
REG NO: 1998/005011/06 FOUNDED: 1998 LISTED: 1998 DIRECTORS: AdamiNJ(ind ne), BoulleCH(alt), Fredericks D (ind ne),
NATURE OF BUSINESS: Fairvest Property Holdings Ltd. is listed in the HalamandresJL(ne), Halamandris N (ne), Maditse A (ind ne),
Retail REIT sector of the JSE Ltd. Fairvest’s objective is to build a Mashilwane E (ind ne), Richards N, Botha S (Chair, ld ind ne),
retail-focused property fund, weighted toward non-metropolitan Hele D (Group CE), Ntlha K (Group FD)
shopping centres and including convenience, community and regional MAJOR ORDINARY SHAREHOLDERS as at 29 Feb 2020
shopping centres servicing the lower-LSM market in high-growth nodes Coronation Asset Management (Pty) Ltd. 14.32%
close to commuter networks. Government Employees Pension Fund 10.80%
SECTOR: RealEstate—RealEstate—REITS—Retail BMO LGM Asset Management Group 8.01%
NUMBER OF EMPLOYEES: 0 POSTAL ADDRESS: PO Box 2884, Halfway House, 1685
DIRECTORS: Andrag L W (ld ind ne), Cohen T J (ind ne), Mkhize N (ind ne), MORE INFO: www.sharedata.co.za/sdo/jse/FBR
Nkuna K R (ind ne), Wiese Adv J D (ind ne), du Toit J F (Chair, ne), COMPANY SECRETARY: Celeste Appollis
WilderDW(CEO),KrielBJ(CFO),MarcusA(COO, alt)
MAJOR ORDINARY SHAREHOLDERS as at 30 Jun 2020 TRANSFER SECRETARY: Computershare Investor Services (Pty) Ltd.
Vukile Property Fund Ltd. 26.56% SPONSOR: Standard Bank
Nedbank Group 9.49% AUDITORS: Deloitte & Touche
STANLIB 6.18% CAPITAL STRUCTURE AUTHORISED ISSUED
POSTAL ADDRESS: Postnet Suite 30, Private Bag X3, Roggebaai, 8012 FBR Ords 1c ea 200 000 000 100 202 284
MORE INFO: www.sharedata.co.za/sdo/jse/FVT DISTRIBUTIONS [ZARc]
COMPANY SECRETARY: FluidRock Co Sec (Pty) Ltd. Ords 1c ea Ldt Pay Amt
TRANSFER SECRETARY: Computershare Investor Services (Pty) Ltd. Interim No 45 3 Dec 19 9 Dec 19 90.00
SPONSOR: PSG Capital (Pty) Ltd. Final No 44 2 Jul 19 8 Jul 19 100.00
AUDITORS: BDO South Africa Inc.
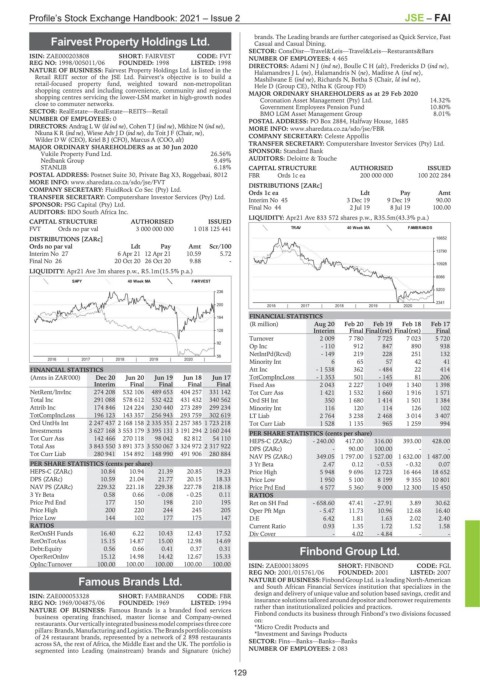
LIQUIDITY: Apr21 Ave 833 572 shares p.w., R35.5m(43.3% p.a.)
CAPITAL STRUCTURE AUTHORISED ISSUED
FVT Ords no par val 3 000 000 000 1 018 125 441 TRAV 40 Week MA FAMBRANDS
DISTRIBUTIONS [ZARc] 16652
Ords no par val Ldt Pay Amt Scr/100
Interim No 27 6 Apr 21 12 Apr 21 10.59 5.72 13790
Final No 26 20 Oct 20 26 Oct 20 9.88 -
10928
LIQUIDITY: Apr21 Ave 3m shares p.w., R5.1m(15.5% p.a.)
8066
SAPY 40 Week MA FAIRVEST
5203
236
2341
200 2016 | 2017 | 2018 | 2019 | 2020 |
FINANCIAL STATISTICS
164
(R million) Aug 20 Feb 20 Feb 19 Feb 18 Feb 17
128 Interim Final Final(rst) Final(rst) Final
Turnover 2 009 7 780 7 725 7 023 5 720
92
Op Inc - 110 912 847 890 938
NetIntPd(Rcvd) - 149 219 228 251 132
56
2016 | 2017 | 2018 | 2019 | 2020 |
Minority Int 6 65 57 42 41
FINANCIAL STATISTICS Att Inc - 1 538 362 - 484 22 414
(Amts in ZAR'000) Dec 20 Jun 20 Jun 19 Jun 18 Jun 17 TotCompIncLoss - 1 353 501 - 145 81 206
Interim Final Final Final Final Fixed Ass 2 043 2 227 1 049 1 340 1 398
NetRent/InvInc 274 208 532 106 489 653 404 257 331 142 Tot Curr Ass 1 421 1 532 1 660 1 916 1 571
Total Inc 291 088 578 612 532 422 431 432 340 562 Ord SH Int 350 1 680 1 414 1 501 1 384
Attrib Inc 174 846 124 224 230 440 273 289 299 234 Minority Int 116 120 114 126 102
TotCompIncLoss 196 123 143 357 256 943 293 759 302 619 LT Liab 2 764 3 238 2 468 3 014 3 407
Ord UntHs Int 2 247 437 2 168 158 2 335 351 2 257 385 1 723 218 Tot Curr Liab 1 528 1 135 965 1 259 994
Investments 3 627 168 3 553 179 3 395 131 3 191 294 2 160 244 PER SHARE STATISTICS (cents per share)
Tot Curr Ass 142 466 270 118 98 042 82 812 54 110 HEPS-C (ZARc) - 240.00 417.00 316.00 393.00 428.00
Total Ass 3 843 550 3 891 373 3 550 067 3 324 972 2 317 922
DPS (ZARc) - 90.00 100.00 - -
Tot Curr Liab 280 941 154 892 148 990 491 906 280 884
NAV PS (ZARc) 349.05 1 797.00 1 527.00 1 632.00 1 487.00
PER SHARE STATISTICS (cents per share) 3 Yr Beta 2.47 0.12 - 0.53 - 0.32 0.07
HEPS-C (ZARc) 10.84 10.94 21.39 20.85 19.23 Price High 5 948 9 696 12 723 16 464 18 652
DPS (ZARc) 10.59 21.04 21.77 20.15 18.33 Price Low 1 950 5 100 8 199 9 355 10 801
NAV PS (ZARc) 229.32 221.18 229.38 227.78 218.18 Price Prd End 4 577 5 360 9 000 12 300 15 450
3 Yr Beta 0.58 0.66 - 0.08 - 0.25 0.11 RATIOS
Price Prd End 177 150 198 210 195 Ret on SH Fnd - 658.60 47.41 - 27.91 3.89 30.62
Price High 200 220 244 245 205 Oper Pft Mgn - 5.47 11.73 10.96 12.68 16.40
Price Low 144 102 177 175 147 D:E 6.42 1.81 1.63 2.02 2.40
RATIOS Current Ratio 0.93 1.35 1.72 1.52 1.58
RetOnSH Funds 16.40 6.22 10.43 12.43 17.52 Div Cover - 4.02 - 4.84 - -
RetOnTotAss 15.15 14.87 15.00 12.98 14.69
Debt:Equity 0.56 0.66 0.41 0.37 0.31 Finbond Group Ltd.
OperRetOnInv 15.12 14.98 14.42 12.67 15.33
FIN
OpInc:Turnover 100.00 100.00 100.00 100.00 100.00 ISIN: ZAE000138095 SHORT: FINBOND CODE: FGL
REG NO: 2001/015761/06 FOUNDED: 2001 LISTED: 2007
Famous Brands Ltd. NATURE OF BUSINESS: Finbond Group Ltd. is a leading North-American
and South African Financial Services institution that specializes in the
FAM design and delivery of unique value and solution based savings, credit and
ISIN: ZAE000053328 SHORT: FAMBRANDS CODE: FBR
REG NO: 1969/004875/06 FOUNDED: 1969 LISTED: 1994 insurance solutions tailored around depositor and borrower requirements
NATURE OF BUSINESS: Famous Brands is a branded food services rather than institutionalized policies and practices.
Finbond conducts its business through Finbond’s two divisions focussed
business operating franchised, master license and Company-owned on:
restaurants.Our vertically integrated businessmodelcomprises three core *Micro Credit Products and
pillars:Brands,ManufacturingandLogistics. TheBrandsportfolioconsists *Investment and Savings Products
of 24 restaurant brands, represented by a network of 2 898 restaurants
across SA, the rest of Africa, the Middle East and the UK. The portfolio is SECTOR: Fins—Banks—Banks—Banks
segmented into Leading (mainstream) brands and Signature (niche) NUMBER OF EMPLOYEES: 2 083
129