
Page 221 - 2021 Issue 2
P. 221
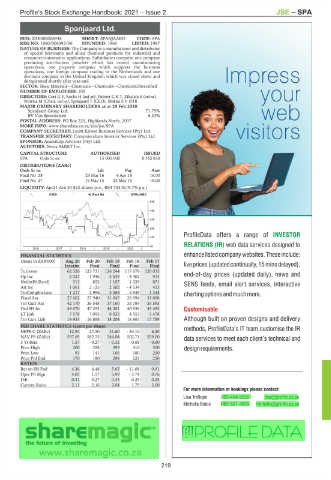
Profile’s Stock Exchange Handbook: 2021 – Issue 2                       JSE – SPA
                   Spanjaard Ltd.
        SPA
       ISIN: ZAE000006938  SHORT: SPANJAARD  CODE: SPA
       REG NO: 1960/004393/06  FOUNDED: 1960  LISTED: 1987
       NATURE OF BUSINESS: The Company is a manufacturer and distributor
        of special lubricants and allied chemical products for industrial and
        consumer/automotive applications. Subsidiaries comprise one company
        producing anti-friction powders which has ceased manufacturing
        operations, one property company which supports the business
        operations, one foreign company trading in the Netherlands and one
        dormant company in the United Kingdom which was closed down and
        deregistered shortly after year-end.
       SECTOR: Basic Materials—Chemicals—Chemicals—Chemicals:Diversified
       NUMBER OF EMPLOYEES: 100
       DIRECTORS: Cort G F, Kocks H (ind ne), Palmer C K T, Zikalala S (ind ne),
        Notrica M (Chair, ind ne), Spanjaard T (CEO), Makan S V (FD)
       MAJOR ORDINARY SHAREHOLDERS as at 29 Feb 2020
         Spanjaard Group Ltd.             71.75%
         BV Von Spreckelsen                6.23%
       POSTAL ADDRESS: PO Box 225, Highlands North, 2037
       MORE INFO: www.sharedata.co.za/sdo/jse/SPA
       COMPANY SECRETARY: Levitt Kirson Business Services (Pty) Ltd.
       TRANSFER SECRETARY: Computershare Investor Services (Pty) Ltd.
       SPONSOR: AcaciaCap Advisors (Pty) Ltd.
       AUDITORS: Nexia SAB&T Inc.
       CAPITAL STRUCTURE   AUTHORISED     ISSUED
       SPA  Ords 5c ea       15 000 000  8 142 850
       DISTRIBUTIONS [ZARc]
       Ords 5c ea            Ldt    Pay     Amt
       Final No 28       23 Mar 16  4 Apr 16  16.00
       Final No 27       15 May 15  25 May 15  18.00
       LIQUIDITY: Apr21 Ave 30 842 shares p.w., R94 733.0(19.7% p.a.)
               CHES       40 Week MA  SPANJAARD
                                           548
                                           448
                                           348
                                           248
                                           148
                                           48
          2016  |  2017  |  2018  |  2019  |  2020  |
       FINANCIAL STATISTICS
       (Amts in ZAR'000)  Aug 20  Feb 20  Feb 19  Feb 18  Feb 17
                   Interim  Final  Final  Final  Final
       Turnover     62 326  123 731  126 244  117 678  120 055
       Op Inc        2 527  1 946  5 039  - 4 402  914
       NetIntPd(Rcvd)  311  852  1 197  1 029  871
       Att Inc       1 061  2 125  2 502  - 4 534  413
       TotCompIncLoss  1 217  2 996  3 365  - 4 549  1 445
       Fixed Ass    27 602  27 940  31 047  28 994  31 098
       Tot Curr Ass  42 170  36 548  37 160  33 784  35 595
       Ord SH Int   48 670  47 453  44 301  40 936  45 485
       LT Liab       7 578  7 095  8 025  4 553  5 478
       Tot Curr Liab  19 955  16 888  18 204  18 867  17 789
       PER SHARE STATISTICS (cents per share)
       HEPS-C (ZARc)  12.94  27.50  31.60  - 54.10  6.20
       NAV PS (ZARc)  597.69  582.75  544.04  502.71  559.00
       3 Yr Beta     1.57  - 0.27  - 0.32  - 0.68  - 0.60
       Price High     200  298   399   410  500
       Price Low      93   141   166   180  250
       Price Prd End  170  180   298   225  250
       RATIOS
       Ret on SH Fnd  4.36  4.48  5.65  - 11.08  0.91
       Oper Pft Mgn  4.05  1.57  3.99  - 3.74  0.76
       D:E           0.31  0.27  0.35  0.29  0.25
       Current Ratio  2.11  2.16  2.04  1.79  2.00


                                               219