
Page 88 - 2021 Issue 2
P. 88
JSE – ALE Profile’s Stock Exchange Handbook: 2021 – Issue 2
ALSH 40 Week MA ALARIS FINANCIAL STATISTICS
(R million) Sep 20 Mar 20 Mar 19 Mar 18 Mar 17
360
Interim Final Final(rst) Final(rst) Final(rst)
Net Revenue 1 542 3 153 3 136 3 010 3 470
310
Op Profit 357 - 526 523 674 800
260
NetIntPd(Rcvd) - 33 - 12 - 52 - 112 - 89
Minority Int 15 191 54 87 109
210
Att Inc 183 - 145 336 240 1 465
160 TotCompIncLoss 193 105 457 284 1 049
Fixed Ass 601 624 731 174 202
110
2016 | 2017 | 2018 | 2019 | 2020 | Inv & Loans 306 973 272 585 299 852 297 110 281 818
Tot Curr Ass 6 485 6 873 8 752 7 959 8 274
FINANCIAL STATISTICS
(Amts in ZAR'000) Dec 20 Jun 20 Jun 19 Jun 18 Jun 17 Ord SH Int 4 291 4 806 5 645 6 010 6 901
Interim Final Final Final Final Minority Int 40 297 299 287 218
Turnover 154 365 242 753 245 184 187 075 159 350 LT Liab 307 062 272 798 300 717 298 729 283 556
Op Inc 36 802 39 535 54 125 42 722 37 316 Tot Curr Liab 4 566 4 152 5 947 4 220 3 760
NetIntPd(Rcvd) - 237 - 1 244 - 256 12 4 167 PER SHARE STATISTICS (cents per share)
Att Inc 29 097 30 985 41 081 32 919 31 822 HEPS-C (ZARc) 18.80 32.20 32.90 34.50 53.40
TotCompIncLoss 17 092 51 005 41 109 35 791 27 100 DPS (ZARc) 13.00 80.00 60.00 42.00 63.00
Fixed Ass 8 767 9 376 7 242 6 619 5 793 NAV PS (ZARc) 329.57 394.58 461.57 505.00 555.00
Tot Curr Ass 211 073 183 064 141 945 107 104 109 424 3 Yr Beta 0.23 0.19 - 0.22 0.73 -
Ord SH Int 241 916 221 110 165 182 116 328 77 830 Price High 490 647 720 770 810
LT Liab 12 057 18 864 3 741 2 103 1 434 Price Low 300 280 420 526 550
Tot Curr Liab 51 577 43 414 49 472 37 195 76 488 Price Prd End 350 428 503 720 643
PER SHARE STATISTICS (cents per share) RATIOS
HEPS-C (ZARc) 24.40 25.89 34.29 28.35 14.94 Ret on SH Fnd 9.14 0.90 6.56 5.19 22.11
NAV PS (ZARc) 202.86 184.67 137.87 100.18 67.03 Oper Pft Mgn 23.15 - 16.68 16.68 22.39 23.05
3 Yr Beta 0.89 0.08 - 1.02 - 1.62 - 0.49 D:E 70.90 53.46 50.59 47.44 39.83
Current Ratio 1.42 1.66 1.47 1.89 2.20
Price High 400 260 350 230 293
Price Low 171 150 105 110 170 Div Cover 1.08 - 0.15 0.45 0.45 1.82
Price Prd End 239 220 250 200 215
RATIOS
Ret on SH Fnd 24.06 14.01 24.87 28.30 40.89
Oper Pft Mgn 23.84 16.29 22.08 22.84 23.42
D:E 0.05 0.10 0.03 0.02 0.02
Current Ratio 4.09 4.22 2.87 2.88 1.43
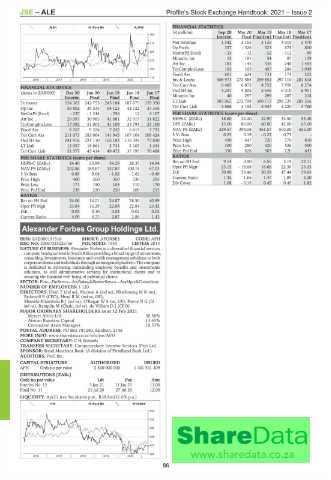
Alexander Forbes Group Holdings Ltd.
ALE
ISIN: ZAE000191516 SHORT: AFORBES CODE: AFH
REG NO: 2006/025226/06 FOUNDED: 1935 LISTED: 2014
NATURE OF BUSINESS: Alexander Forbes is a diversified financial services
companyheadquarteredinSouthAfricaprovidingabroadrangeofretirements,
consulting, investments, insurance and wealth management solutions to both
corporateclientsandindividualsthroughanintegratedplatform.Thecompany
is dedicated to delivering outstanding employee benefits and investments
solutions, as well administrative services for institutional clients and to
securing the financial well-being of individual clients.
SECTOR: Fins—FinServcs—InvBnkng&BrokerServcs—AssMgrs&Custodians
NUMBER OF EMPLOYEES: 3 120
DIRECTORS: Dloti T (ind ne), Mazwai A (ind ne), NkadimengMR(ne),
Bydawell B (CFO), HeadRM(ind ne, UK),
Memela-KhambulaBJ(ind ne), O'ReganWS(ne, UK), PayneNG(ld
ind ne), Ramplin M (Chair, ind ne), de Villiers D J (CEO)
MAJOR ORDINARY SHAREHOLDERS as at 12 Feb 2021
Mercer Africa Ltd. 30.58%
African Rainbow Capital 13.65%
Coronation Asset Managers 10.51%
POSTAL ADDRESS: PO Box 787240, Sandton, 2146
MORE INFO: www.sharedata.co.za/sdo/jse/AFH
COMPANY SECRETARY: C H Wessels
TRANSFER SECRETARY: Computershare Investor Services (Pty) Ltd.
SPONSOR: Rand Merchant Bank (A division of FirstRand Bank Ltd.)
AUDITORS: PwC Inc.
CAPITAL STRUCTURE AUTHORISED ISSUED
AFH Ords no par value 2 500 000 000 1 401 541 409
DISTRIBUTIONS [ZARc]
Ords no par value Ldt Pay Amt
Interim No 12 5 Jan 21 11 Jan 21 13.00
Final No 11 21 Jul 20 27 Jul 20 12.00
LIQUIDITY: Apr21 Ave 9m shares p.w., R38.8m(31.6% p.a.)
FINI 40 Week MA AFORBES
834
732
629
526
423
320
2016 | 2017 | 2018 | 2019 | 2020 |
86