
Page 242 - 2021 Issue 2
P. 242
JSE – WES Profile’s Stock Exchange Handbook: 2021 – Issue 2
FINANCIAL STATISTICS Fixed Ass 2 360 235 2 203 133 1 954 201 1 949 160 641 198
(Amts in ZAR'000) Aug 20 Feb 20 Feb 19 Feb 18 Feb 17 Inv & Loans 94 369 83 483 48 506 43 520 18 618
Interim Final Final Final Final Tot Curr Ass 1 207 787 1 258 200 1 184 018 820 198 773 584
Turnover 288 191 462 156 425 329 350 889 184 192 Ord SH Int 894 752 883 045 1 080 597 1 036 786 684 632
Op Inc 39 437 56 376 112 416 61 427 49 583 Minority Int - - 10 999 10 388 -
NetIntPd(Rcvd) - 732 4 988 4 459 7 463 1 082 LT Liab 2 153 553 1 217 662 1 049 514 1 063 400 277 918
Minority Int 4 366 3 575 1 699 4 495 1 957 Tot Curr Liab 1 027 149 1 860 743 1 210 962 889 625 629 307
Att Inc 31 605 35 893 88 553 41 061 38 081
TotCompIncLoss 32 255 27 487 92 411 44 364 37 795 PER SHARE STATISTICS (cents per share)
Fixed Ass 21 240 27 903 10 977 10 404 10 535 HEPS-C (ZARc) 3.32 - 32.67 17.50 46.37 11.28
Inv & Loans 115 190 112 305 93 565 50 720 38 109 DPS (ZARc) - - - 10.89 6.88
Tot Curr Ass 450 311 726 341 297 574 817 246 835 942 NAV PS (ZARc) 218.00 211.00 253.00 239.00 196.00
Ord SH Int 517 567 487 089 469 269 399 903 356 800 3 Yr Beta - 0.36 - 0.06 - 0.49 0.83 0.98
Minority Int 73 628 70 674 8 380 - 566 - 4 021 Price High 120 170 220 249 270
LT Liab 511 271 498 242 68 402 90 017 139 025 Price Low 55 102 140 155 130
Tot Curr Liab 371 271 564 441 252 893 792 802 792 485 Price Prd End 61 120 144 167 228
PER SHARE STATISTICS (cents per share) RATIOS
HEPS-C (ZARc) 19.70 0.60 54.70 26.70 20.80 Ret on SH Fnd 2.40 - 15.47 8.09 19.29 4.41
DPS (ZARc) 5.00 - 7.40 6.20 5.20 Oper Pft Mgn 4.89 - 0.07 5.65 9.76 5.80
NAV PS (ZARc) 321.20 302.20 291.20 242.50 221.20 D:E 2.59 2.49 1.35 1.31 0.81
3 Yr Beta - 0.18 - 0.24 - 0.41 0.47 0.54 Current Ratio 1.18 0.68 0.98 0.92 1.23
Price High 250 280 300 320 230 Div Cover - - - 4.42 1.69
Price Low 116 103 101 180 70
Price Prd End 240 199 200 300 220 Wesizwe Platinum Ltd.
RATIOS
WES
Ret on SH Fnd 12.17 7.08 18.90 11.41 11.35 ISIN: ZAE000075859 SHORT: WESIZWE CODE: WEZ
Oper Pft Mgn 13.68 12.20 26.43 17.51 26.92 REG NO: 2003/020161/06 FOUNDED: 2003 LISTED: 2005
D:E 0.89 0.91 0.16 0.23 0.39 NATURE OF BUSINESS:Wesizwe is a public company incorporated in the
Current Ratio 1.21 1.29 1.18 1.03 1.05 Republic of South Africa and its shares are listed on the JSE.
Div Cover 3.94 - 7.39 4.19 5.79 The Group’s main strategic project is to build and operate South Africa’s
next platinum group metals mine at its Bakubung Minerals (Pty) Ltd.
Wescoal Holdings Ltd. ("Bakubung") operation also known as Bakubung Platinum Mine (“BPM”),
which is owned by Wesizwe, firmly positioning the Group as a significant
mid-tier precious metals producer.
WES
ISIN: ZAE000069639 SHORT: WESCOAL CODE: WSL
REG NO: 2005/006913/06 FOUNDED: 1996 LISTED: 2005 SECTOR: Basic Materials—Basic Resrcs—PreciousMet&Min—Plat&PrecMet
NATURE OF BUSINESS: The main business of the Group is the mining, NUMBER OF EMPLOYEES: 180
processing, sale and supply of coal. Coal product is mined, sourced and DIRECTORS: GuoH(ne), MabuzaVT(ind ne), Ngculu J (ind ne),
supplied to clients in local industry including power generation, Pengfei L (ne), Pingan S (ne), MokhoboDNM (Chair, ind ne),
manufacturing and petro-chemicals sectors.The key strategic thrust of Li Z (CEO), Liu J (FD)
Wescoal is to be a leading junior coal miner with a sustainable resource MAJOR ORDINARY SHAREHOLDERS as at 31 Dec 2019
base and a coal trading operation. China-Africa Jinchuan Inv Ltd. 45.00%
SECTOR: Energy—Energy—OilGas&Coal—Coal Rustenburg Platinum Mines Ltd. 13.01%
NUMBER OF EMPLOYEES: 20 Micawber 809 (Pty) Ltd. 5.98%
DIRECTORS: Mabizela A (ind ne), Maroga K (ind ne), POSTAL ADDRESS: Private Bag X16, Northlands, 2116
Maswanganyi C (ne), MnxasanaNP(ind ne), MzimelaET(ne), MORE INFO: www.sharedata.co.za/sdo/jse/WEZ
Siyotula N (ld ind ne), Tshithavhane T, Mathe Dr H (Chair, ne), COMPANY SECRETARY: Vasta Mhlongo
Ramaite M R (Interim CEO), Speckman J (CFO) TRANSFER SECRETARY: 4 Africa Exchange Registry (Pty) Ltd.
MAJOR ORDINARY SHAREHOLDERS as at 24 Dec 2020 SPONSOR: PSG Capital (Pty) Ltd.
K2016316243 (SA) (Pty) Ltd. 47.70% AUDITORS: SizweNtsalubaGobodo Inc.
Wescoal Holdings Ltd. 6.24% CAPITAL STRUCTURE AUTHORISED ISSUED
Muthanyi Robinson Ramaite 5.45%
POSTAL ADDRESS: PO Box 1962, Edenvale, 1610 WEZ Ords no par 2 000 000 000 1 627 827 058
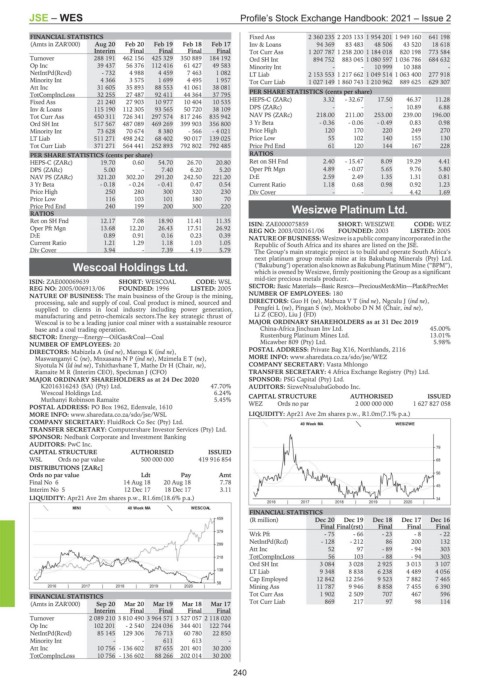
MORE INFO: www.sharedata.co.za/sdo/jse/WSL LIQUIDITY: Apr21 Ave 2m shares p.w., R1.0m(7.1% p.a.)
COMPANY SECRETARY: FluidRock Co Sec (Pty) Ltd. 40 Week MA WESIZWE
TRANSFER SECRETARY: Computershare Investor Services (Pty) Ltd.
SPONSOR: Nedbank Corporate and Investment Banking
AUDITORS: PwC Inc.
79
CAPITAL STRUCTURE AUTHORISED ISSUED
WSL Ords no par value 500 000 000 419 916 854 68
DISTRIBUTIONS [ZARc]
Ords no par value Ldt Pay Amt 56
Final No 6 14 Aug 18 20 Aug 18 7.78
45
Interim No 5 12 Dec 17 18 Dec 17 3.11
LIQUIDITY: Apr21 Ave 2m shares p.w., R1.6m(18.6% p.a.) 34
2016 | 2017 | 2018 | 2019 | 2020 |
MINI 40 Week MA WESCOAL
FINANCIAL STATISTICS
459 (R million) Dec 20 Dec 19 Dec 18 Dec 17 Dec 16
Final Final(rst) Final Final Final
379
WrkPft -75 - 66 -23 - 8 - 22
NetIntPd(Rcd) - 128 - 212 86 200 132
299
Att Inc 52 97 - 89 - 94 303
218 TotCompIncLoss 56 103 - 88 - 94 303
Ord SH Int 3 084 3 028 2 925 3 013 3 107
138
LT Liab 9 348 8 838 6 238 4 489 4 056
Cap Employed 12 842 12 256 9 523 7 882 7 465
58
2016 | 2017 | 2018 | 2019 | 2020 | Mining Ass 11 787 9 946 8 858 7 455 6 390
FINANCIAL STATISTICS Tot Curr Ass 1 902 2 509 707 467 596
(Amts in ZAR'000) Sep 20 Mar 20 Mar 19 Mar 18 Mar 17 Tot Curr Liab 869 217 97 98 114
Interim Final Final Final Final
Turnover 2 089 210 3 810 490 3 964 571 3 527 057 2 118 020
Op Inc 102 201 - 2 540 224 036 344 401 122 744
NetIntPd(Rcvd) 85 145 129 306 76 713 60 780 22 850
Minority Int - - 611 613 -
Att Inc 10 756 - 136 602 87 655 201 401 30 200
TotCompIncLoss 10 756 - 136 602 88 266 202 014 30 200
240