
Page 178 - 2021 Issue 2
P. 178
JSE – NED Profile’s Stock Exchange Handbook: 2021 – Issue 2
opportunities efficiently, benefiting from a strategic advantage in the
Nedbank Ltd. acquisition, development and management of properties.
NED SECTOR: RealEstate—RealEstate—InvestmentServices—Holdings
ISIN: ZAE000043667 SHORT: NEDBANK-P CODE: NBKP NUMBER OF EMPLOYEES: 444
REG NO: 1951/000009/06 FOUNDED: 1951 LISTED: 2002 DIRECTORS: Aase G (ind ne), Brown S (ne), de Lange A (ind ne),
NATURE OF BUSINESS: Nedbank Ltd. (‘Nedbank’ or ‘the company’) is a DijkstraALV(ind ne, Neth), Klingen A (ld ind ne), MajijaSV(alt),
registered bank that, through its subsidiaries, provides a wide range of NoetzelMP(Pol), OlivierAK(alt), van der Veer A (ind ne), Emslie R R
banking and financial services. Nedbank maintains a primary listing of its (Chair, ind ne), Morar A (CEO, Rom), Covasa M (CFO, Rom)
non-redeemable, non-cumulative, non-participating preference shares MAJOR ORDINARY SHAREHOLDERS as at 17 Dec 2020
under ‘Preference Shares’ on JSE Ltd. (‘the JSE’). Fortress REIT Ltd. 21.71%
SECTOR: Add—Debt—Preference Shares—Pref Shares Resilient REIT Ltd. 12.66%
NUMBER OF EMPLOYEES: 30 877 Public Investment Corporation 10.07%
DIRECTORS: Brody H R (ind ne), Dames B A (ind ne), Dongwana N P (ind ne), POSTAL ADDRESS: 2nd Floor, 30 Athol Street, Douglas, Isle of Man, IM1
Kruger E M (ind ne), Leith R AG(ne), Makalima L (ind ne), Makwana P M 1JB
(ld ind ne), Marwala Prof T (ind ne), Matooane M A (ind ne), MORE INFO: www.sharedata.co.za/sdo/jse/NRP
Subramoney S (ind ne), Williamson I G (ne), Naidoo V (Chair, ind ne), COMPANY SECRETARY: Cornelius E Cassell
Brown M W T (CE), Davis M (CFO Designate), Nkuhlu M C (COO)
MAJOR ORDINARY SHAREHOLDERS as at 31 Dec 2019 TRANSFER SECRETARY: Computershare Investor Services (Pty) Ltd.
Nedbank Group Ltd. 13.40% SPONSOR: Java Capital
Investec Securities (Pty) Ltd. 8.90% AUDITORS: PwC LLP
Nedgroup Private Wealth (Pty) Ltd. (SA) 8.63% CAPITAL STRUCTURE AUTHORISED ISSUED
POSTAL ADDRESS: PO Box 1144, Johannesburg, 2000 NRP Ords EUR1c ea 2 000 000 000 608 994 907
MORE INFO: www.sharedata.co.za/sdo/jse/NBKP DISTRIBUTIONS [EURc]
COMPANY SECRETARY: Jackie Katzin Ords EUR1c ea Ldt Pay Amt
TRANSFER SECRETARY: JSE Investor Services (Pty) Ltd. Final No 7 16 Mar 21 25 Mar 21 16.88
SPONSORS: Investec Bank Ltd., Nedbank CIB Final No 6 10 Mar 20 6 Apr 20 27.31
AUDITORS: Deloitte & Touche, Ernst & Young Inc.
LIQUIDITY: Apr21 Ave 8m shares p.w., R686.1m(67.2% p.a.)
CAPITAL STRUCTURE AUTHORISED ISSUED
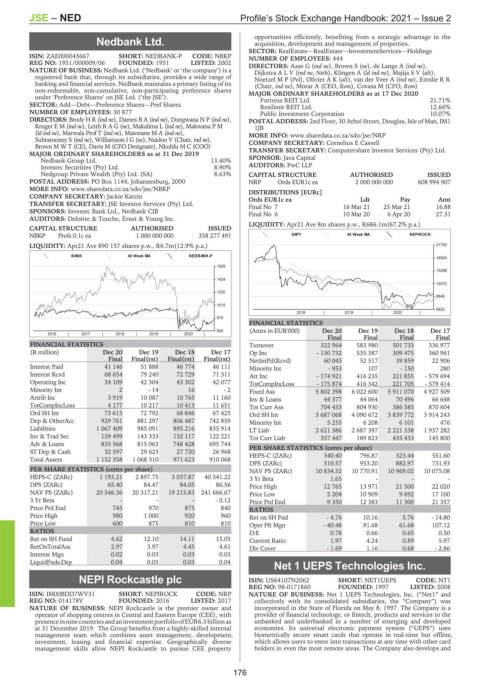
NBKP Prefs 0.1c ea 1 000 000 000 358 277 491 SAPY 40 Week MA NEPIROCK
LIQUIDITY: Apr21 Ave 890 157 shares p.w., R6.7m(12.9% p.a.) 21750
BANK 40 Week MA NEDBANK-P
18524
1629
15298
1424
12072
1220
8846
1015
5620
2018 | 2019 | 2020 |
810
FINANCIAL STATISTICS
605 (Amts in EUR'000) Dec 20 Dec 19 Dec 18 Dec 17
2016 | 2017 | 2018 | 2019 | 2020 |
Final Final Final Final
FINANCIAL STATISTICS Turnover 322 964 583 980 501 733 336 977
(R million) Dec 20 Dec 19 Dec 18 Dec 17 Op Inc - 130 732 535 387 309 475 360 961
Final Final(rst) Final(rst) Final(rst) NetIntPd(Rcvd) 60 045 52 517 39 859 22 906
Interest Paid 41 146 51 888 46 774 46 111 Minority Int - 953 107 - 150 280
Interest Rcvd 68 654 79 240 72 729 71 311 Att Inc - 174 921 416 235 221 855 - 579 694
Operating Inc 34 109 42 304 43 302 42 077 TotCompIncLoss - 175 874 416 342 221 705 - 579 414
Minority Int 2 - 14 16 - 2 Fixed Ass 5 802 398 6 022 600 5 911 070 4 927 509
Attrib Inc 3 919 10 087 10 765 11 160 Inv & Loans 44 377 44 064 70 496 66 648
TotCompIncLoss 4 177 10 217 10 413 11 651 Tot Curr Ass 704 433 804 930 386 585 870 604
Ord SH Int 73 613 72 792 68 846 67 425 Ord SH Int 3 687 068 4 090 672 3 839 772 3 914 243
Dep & OtherAcc 929 761 881 297 806 487 742 859 Minority Int 5 255 6 208 6 101 476
Liabilities 1 067 409 985 091 895 216 835 914 LT Liab 2 621 386 2 687 397 2 221 338 1 937 282
Inv & Trad Sec 159 499 143 333 132 117 122 221 Tot Curr Liab 357 447 189 823 435 433 145 800
Adv & Loans 835 568 815 063 748 428 695 744
ST Dep & Cash 32 597 29 623 27 720 26 968 PER SHARE STATISTICS (cents per share) 323.44 551.60
HEPS-C (ZARc)
796.87
340.40
Total Assets 1 152 358 1 068 310 971 623 910 068
DPS (ZARc) 310.57 953.20 882.97 731.93
PER SHARE STATISTICS (cents per share) NAV PS (ZARc) 10 834.52 10 770.91 10 969.02 10 075.08
HEPS-C (ZARc) 1 193.21 2 897.75 3 037.87 40 541.22 3 Yr Beta 1.65 - - -
DPS (ZARc) 65.40 84.47 84.05 86.56 Price High 12 765 13 971 21 500 22 020
NAV PS (ZARc) 20 546.36 20 317.21 19 215.83 241 666.67 Price Low 5 204 10 909 9 692 17 100
3YrBeta - - - -0.12 Price Prd End 9 350 12 383 11 300 21 357
Price Prd End 745 970 875 840 RATIOS
Price High 980 1 000 920 960 Ret on SH Fnd - 4.76 10.16 5.76 - 14.80
Price Low 600 875 810 810 Oper Pft Mgn - 40.48 91.68 61.68 107.12
RATIOS D:E 0.78 0.66 0.65 0.50
Ret on SH Fund 4.62 12.10 14.11 15.05 Current Ratio 1.97 4.24 0.89 5.97
RetOnTotalAss 2.97 3.97 4.45 4.61 Div Cover - 1.69 1.16 0.68 - 2.86
Interest Mgn 0.02 0.03 0.03 0.03
LiquidFnds:Dep 0.04 0.03 0.03 0.04
Net 1 UEPS Technologies Inc.
NET
NEPI Rockcastle plc ISIN: US64107N2062 SHORT: NET1UEPS CODE: NT1
REG NO: 98-0171860 FOUNDED: 1997 LISTED: 2008
NEP
ISIN: IM00BDD7WV31 SHORT: NEPIROCK CODE: NRP NATURE OF BUSINESS: Net 1 UEPS Technologies, Inc. (“Net1” and
REG NO: 014178V FOUNDED: 2016 LISTED: 2017 collectively with its consolidated subsidiaries, the “Company”) was
NATURE OF BUSINESS: NEPI Rockcastle is the premier owner and incorporated in the State of Florida on May 8, 1997. The Company is a
operator of shopping centres in Central and Eastern Europe (CEE), with provider of financial technology, or fintech, products and services to the
presenceinninecountriesandaninvestmentportfolioofEUR6.3billionas unbanked and underbanked in a number of emerging and developed
at 31 December 2019. The Group benefits from a highly-skilled internal economies. Its universal electronic payment system (“UEPS”) uses
management team which combines asset management, development, biometrically secure smart cards that operate in real-time but offline,
investment, leasing and financial expertise. Geographically diverse which allows users to enter into transactions at any time with other card
management skills allow NEPI Rockcastle to pursue CEE property holders in even the most remote areas. The Company also develops and
176