
Page 96 - SHB 2020 Issue 1
P. 96
JSE – AND Profile’s Stock Exchange Handbook: 2020 – Issue 1
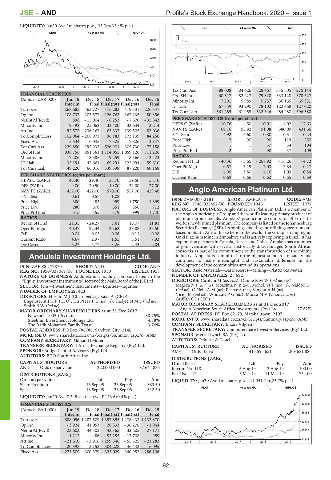
LIQUIDITY: Jan20 Ave 1m shares p.w., R5.3m(33.4% p.a.)
EQII 40 Week MA AND
GENF 40 Week MA ANCHOR
250
1850
200
1545
150
1240
101
935
51
630
1
2015 | 2016 | 2017 | 2018 | 2019
325
2015 | 2016 | 2017 | 2018 | 2019
Tot Curr Ass 388 008 304 426 328 467 315 505 275 144
FINANCIAL STATISTICS Ord SH Int 60 617 82 227 79 828 333 128 378 327
(Amts in ZAR’000) Jun 19 Dec 18 Dec 17 Dec 16 Dec 15 Minority Int 7 201 5 989 5 237 56 165 65 331
Interim Final Final(rst) Final(rst) Final
LT Liab 67 359 93 290 78 102 122 468 127 020
Turnover 268 685 463 727 476 283 419 331 226 347 Tot Curr Liab 561 285 461 955 532 346 484 480 396 580
Op Inc 108 737 103 577 126 763 167 235 80 356
NetIntPd(Rcvd) 898 - 15 004 - 8 253 - 7 670 - 35 543 PER SHARE STATISTICS (cents per share)
Minority Int 9 492 25 062 33 400 33 634 2 214 HEPS-C (ZARc) - 10.76 - 4.50 - 10.01 - 4.02 - 17.63
Att Inc 92 572 - 236 167 63 337 139 505 82 036 NAV PS (ZARc) 69.16 93.82 91.08 380.09 431.66
TotCompIncLoss 102 064 - 208 973 96 183 173 139 84 250 3 Yr Beta - 4.92 - 6.60 - 0.80 - 0.51 - 0.24
Fixed Ass 5 534 6 045 7 325 7 806 3 847 Price High 2 90 90 119 250
Tot Curr Ass 229 850 195 933 526 901 305 730 477 158 Price Low 1 1 37 34 104
Ord SH Int 938 756 851 361 1 104 055 1 059 126 711 206 Price Prd End 2 1 90 37 109
Minority Int 17 206 18 585 19 259 18 366 2 423 RATIOS
LT Liab 35 191 42 661 69 291 122 994 59 610 Ret on SH Fnd - 40.36 - 3.65 - 268.92 - 16.26 - 4.72
Tot Curr Liab 49 220 66 016 339 398 87 220 60 168 Oper Pft Mgn - 0.57 3.19 2.03 - 2.84 - 0.17
D:E 4.05 3.80 4.16 1.09 0.84
PER SHARE STATISTICS (cents per share) Current Ratio 0.69 0.66 0.62 0.65 0.69
HEPS-C (ZARc) 47.40 29.40 33.70 59.50 55.10
DPS (ZARc) 9.00 20.50 10.00 32.00 27.00
NAV PS (ZARc) 457.00 422.00 570.00 557.00 429.48 Anglo American Platinum Ltd.
3 Yr Beta 0.61 0.57 1.08 - - ISIN: ZAE000013181 SHORT: AMPLATS CODE: AMS
ANG
Price High 380 485 999 1 750 1 899 REG NO: 1946/022452/06 FOUNDED: 1946 LISTED: 1977
Price Low 280 308 351 856 712 NATURE OF BUSINESS: Anglo American Platinum Ltd. is a member of
Price Prd End 375 355 379 999 1 740 the Anglo American plc Group and the world’s leading primary producer of
RATIOS platinum group metals. Amplats’ production accounts for 40% of the
Ret on SH Fnd 21.35 - 24.27 8.61 16.07 11.81 world’s newly mined platinum. The company is listed on the Johannesburg
Oper Pft Mgn 40.47 22.34 26.62 39.88 35.50 Securities Exchange (JSE). Its mining, smelting and refining operations are
D:E 0.04 0.05 0.06 0.11 0.08 based in South Africa. Elsewhere in the world, the Group is ramping up
Current Ratio 4.67 2.97 1.55 3.51 7.93 Unki Platinum Mine in Zimbabwe and is actively exploring in Brazil. It has
exploration partners in Canada, Russia and China. Amplats has a number
Div Cover 5.27 - 5.77 3.26 2.43 2.04 of joint ventures with several historically disadvantaged South African
consortia as part of its commitment to the transformation of the mining
Andulela Investment Holdings Ltd. industry. Amplats is committed to the highest standards of safety and
continues to make meaningful and sustainable difference in the
AND development of the communities around its operations.
ISIN: ZAE000172870 SHORT: AND CODE: AND
REG NO: 1950/037061/06 FOUNDED: 1950 LISTED: 1958 SECTOR: Basic Materials—Basic Resrcs—Mining—Plat&Prcs Metals
NATURE OF BUSINESS: Andulela is a holding company listed in the NUMBER OF EMPLOYEES: 28 692
“Equity Investment Instruments” sector of the Main Board of the JSE Ltd. DIRECTORS: Cutifani M (ne, Aus), Dunne R M W (ind ne, UK),
SECTOR: Fins—Investment Instruments—Equities—Equities Mageza N P (ind ne), Mbazima N B (ne), Moholi N T (ind ne), Naidoo D
NUMBER OF EMPLOYEES: 423 (ind ne), O’Neill A M (ne), Pearce S (ne), Sangqu A H (ne),
DIRECTORS: Husain M J (Chair, ind ne), Kaka A (CEO), Vice J M (ind ne), Whitcutt P G (alt), Moosa M V (Chair, ind ne),
Engelbrecht J H P (CFO), Du Preez P E (ind ne), Hadjee N M S (ind ne), Griffith C I (CEO)
Smith B W (ind ne) MAJOR ORDINARY SHAREHOLDERS as at 31 Dec 2017
MAJOR ORDINARY SHAREHOLDERS as at 31 Dec 2017 Anglo American South Africa Investments (Pty) Ltd. 77.62%
Newshelf 1005 (Pty) Ltd. 88.75% POSTAL ADDRESS: PO Box 62179, Marshalltown, 2107
Steelmin Investment Holdings Ltd. 4.38% MORE INFO: www.sharedata.co.za/v2/Scripts/Summary.aspx?c=AMS
The Rafik Mohamed Family Trust 3.74% COMPANY SECRETARY: Elizna Viljoen
POSTAL ADDRESS: PO Box 786786, Sandton City, 2146 TRANSFER SECRETARY: Computershare Investor Services (Pty) Ltd.
MORE INFO: www.sharedata.co.za/v2/Scripts/Summary.aspx?c=AND SPONSOR: Merrill Lynch SA (Pty) Ltd.
COMPANY SECRETARY: Gillian H Miller AUDITORS: Deloitte & Touche
TRANSFER SECRETARY: 4 Africa Exchange Registry (Pty) Ltd. CAPITAL STRUCTURE AUTHORISED ISSUED
SPONSOR: Bridge Capital Advisors (Pty) Ltd. AMS Ords 10c ea 413 595 651 269 681 886
AUDITORS: BDO South Africa Inc.
DISTRIBUTIONS [ZARc]
CAPITAL STRUCTURE AUTHORISED ISSUED Ords 10c ea Ldt Pay Amt
AND Ords no par value 220 000 000 87 644 835 Interim No 118 5 Aug 19 12 Aug 19 1100.00
DISTRIBUTIONS [ZARc] Final No 117 5 Mar 19 11 Mar 19 751.00
Ords no par value Ldt Pay Amt LIQUIDITY: Jan20 Ave 1m shares p.w., R1 051.1m(25.7% p.a.)
Share Premium 16 Sep 05 26 Sep 05 383.50
Special 16 Sep 05 26 Sep 05 312.50 PLAT 40 Week MA AMPLATS
LIQUIDITY: Jan20 Ave 7 349 shares p.w., R173.6(0.4% p.a.) 134308
FINANCIAL STATISTICS 109695
(Amts in ZAR’000) Jun 19 Dec 18 Dec 17 Dec 16 Dec 15
Interim Final Final(rst) Final(rst) Final 85083
Turnover 688 056 1 287 509 1 397 895 1 278 433 1 132 870
60470
Op Inc - 3 924 41 053 28 333 - 36 276 - 1 944
NetIntPd(Rcvd) 23 603 44 303 43 365 32 605 27 171 35857
Minority Int 1 212 - 486 - 52 155 - 12 708 - 959
Att Inc - 21 610 - 3 916 - 259 546 - 55 325 - 21 283 2015 | 2016 | 2017 | 2018 | 2019 11244
TotCompIncLoss - 20 398 3 152 - 304 228 - 46 442 6 095
Fixed Ass 273 509 300 379 325 029 340 952 286 106
92