
Page 213 - 2021 Issue 2
P. 213
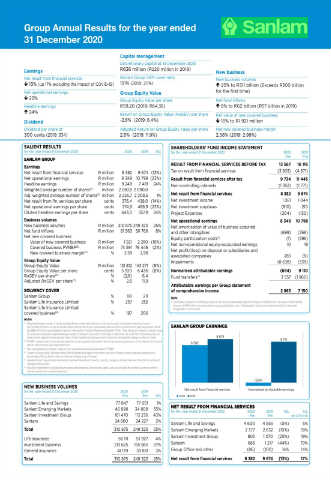
Group Annual Results for the year ended
31 December 2020
Capital management
Discretionary capital at 31 December 2020
Earnings R636 million (R220 million in 2019) New business
Net result from fi nancial services Sanlam Group SAM cover ratio New business volumes
13% (up 17% excluding the impact of COVID-19) 191% (2019: 211%) 25% to R311 billion (Exceeds R300 billion
Net operational earnings Group Equity Value for the fi rst time)
23% Group Equity Value per share Net fund infl ows
Headline earnings R59,20 (2019: R64,36) 8% to R62 billion (R57 billion in 2019)
24%
Return on Group Equity Value (RoGEV) per share Net value of new covered business
Dividend -2.8% (2019: 6.4%) 16% to R1 921 million
Dividend per share of Adjusted Return on Group Equity Value per share Net new covered business margin
300 cents (2019: 334) 2.6% (2019: 11.9%) 2.58% (2019: 2.98%)
SALIENT RESULTS SHAREHOLDERS’ FUND INCOME STATEMENT
for the year ended 31 December 2020 2020 2019 % for the year ended 31 December 2020 2020 2019
R’m R’m
SANLAM GROUP
Earnings RESULT FROM FINANCIAL SERVICES BEFORE TAX 13 567 16 116
Net result from fi nancial services R million 8 382 9 674 (13%) Tax on result from fi nancial services (3 833) (4 671)
Net operational earnings R million 8 349 10 798 (23%) Result from fi nancial services after tax 9 734 11 445
Headline earnings R million 9 249 7 481 24% Non-controlling interests (1 352) (1 771)
Weighted average number of shares million 2 087,8 2 090,0 –
(1)
Adj. weighted average number of shares million 2 226,7 2 208,5 1% Net result from fi nancial services 8 382 9 674
(1)
Net result from fi n. services per share cents 376,4 438,0 (14%) Net investment income 1 081 1 044
Net operational earnings per share cents 374,9 488,9 (23%) Net investment surpluses (810) 210
Diluted headline earnings per share cents 443,0 357,9 24% Project Expenses (304) (130)
Business volumes Net operational earnings 8 349 10 798
New business volumes R million 310 875 249 323 25% Net amortisation of value of business acquired
Net fund infl ows R million 61 563 56 766 8% and other intangibles (699) (766)
Net new covered business Equity participation costs (1) (596)
(1)
Value of new covered business R million 1 921 2 280 (16%) Net non-operational equity-accounted earnings 10 19
Covered business PVNBP R million 74 591 76 446 (2%) Net profi t/(loss) on disposal or subsidiaries and
(2)
New covered business margin % 2,58 2,98 associated companies 285 (6)
(3)
Group Equity Value Impairments (8 638) (339)
Group Equity Value R million 131 812 143 271 (8%)
Group Equity Value per share cents 5 920 6 436 (8%) Normalised attributable earnings (694) 9 110
RoGEV per share % (2,8) 6,4 Fund transfers 3 557 (1 960)
(4)
(1)
Adjusted RoGEV per share % 2,6 11,9
(5)
Attributable earnings per Group statement
SOLVENCY COVER of comprehensive income 2 863 7 150
Sanlam Group % 191 211 Note
Sanlam Life Insurance Limited % 257 253 (1) The B-BBEE transaction in 2019 gave rise to a non-recurring share-based payment charge of R1 686 million. The above market-related
Sanlam Life Insurance Limited discount of R594 million was recognised as equity participation cost in Shareholders’ fund income statement, with the remainder
recognised in fund transfers.
covered business % 197 206
(6)
Notes
(1) Weighted average number of shares excludes Sanlam shares held directly or indirectly through consolidated investment funds in
policyholder portfolios, as well as Sanlam shares held by the Group’s broad-based black economic empowerment special purposes vehicle SANLAM GROUP EARNINGS
(B-BBEE SPV) that is consolidated in terms of International Financial Reporting Standards (IFRS). These shares are treated as shares in issue
for purposes of adjusted weighted average number of shares in issue, which is the base to determine net result from fi nancial services per
share and net operational earnings per share. Diluted headline earnings per share is based on the weighted average number of shares. 9 674 9 110
(2) PVNBP = present value of new business premiums and is equal to the present value of new recurring premiums, at the relevant risk discount 8 382
rate for each business, plus single premiums.
(3) New covered business margin = value of new covered business as a percentage of PVNBP.
(4) Growth in Group Equity Value per share (with dividends paid, capital movements and cost of treasury shares acquired reversed) as a
percentage of Group Equity Value per share at the beginning of the year.
(5) Adjusted RoGEV equals RoGEV excluding investment market and currency volatility, changes in interest rates and other factors outside of
management’s control.
(6) Excludes investments in subsidiaries and associated companies, discretionary capital, cash accumulated for dividend payments and the
netasset value of non-covered operations.
(694)
NEW BUSINESS VOLUMES Net result from fi nancial services Normalised attributable earnings
for the year ended 31 December 2020 2020 2019
R’m R’m % 2020 2019
Sanlam Life and Savings 77 847 77 051 1% NET RESULT FROM FINANCIAL SERVICES
Sanlam Emerging Markets 46 898 34 809 35% for the year ended 31 December 2020 2020 2019 % %
Sanlam Investment Group 161 470 113 236 43% R’m R’m (ex COVID-19)
Santam 24 660 24 227 2%
Sanlam Life and Savings 4 600 4 855 (5%) 5%
Total 310 875 249 323 25% Sanlam Emerging Markets 2 377 2 632 (10%) 19%
Sanlam Investment Group 805 1 070 (25%) 19%
Life insurance 56 111 53 927 4%
Investment business 213 625 155 565 37% Santam 686 1 217 (44%) 79%
General insurance 41 139 39 831 3% Group Offi ce and other (86) (100) 14% 14%
Total 310 875 249 323 25% Net result from fi nancial services 8 382 9 674 (13%) 17%
JSE R&E book AR2020 v20210429.indd 1 29.04.2021 14:21:03