
Page 229 - 2021 Issue 2
P. 229
Profile’s Stock Exchange Handbook: 2021 – Issue 2 JSE – TEL
FINANCIAL STATISTICS Att Inc 1 079 603 2 795 3 052 3 797
(Amts in ZAR'000) Dec 20 Jun 20 Jun 19 Jun 18 Jun 17 TotCompIncLoss 320 1 451 4 139 2 484 3 757
Interim Final Final Final Final Fixed Ass 33 772 33 608 32 035 30 377 27 918
Turnover 41 654 79 666 100 037 113 568 120 628 L-T Invest 76 62 78 100 40
Op Inc 108 2 194 152 4 508 4 189 Tot Curr Ass 15 518 16 315 14 983 14 083 13 924
NetIntPd(Rcvd) 187 - 846 - 76 369 563 Ord SH Int 29 260 29 390 29 573 26 936 27 569
Att Inc - 57 1 090 1 043 3 101 2 457 Minority Int - 28 - 29 195 359 337
TotCompIncLoss - 1 090 1 043 3 101 2 457 LT Liab 15 723 14 767 6 740 10 278 7 004
Fixed Ass 8 511 7 527 10 170 14 741 20 081 Tot Curr Liab 15 940 17 258 16 436 12 927 13 139
Inv & Loans - 2 700 - - -
Tot Curr Ass 22 788 22 917 23 370 24 879 24 625 PER SHARE STATISTICS (cents per share) 619.20 597.00 721.10
HEPS-C (ZARc)
219.00
208.10
Ord SH Int 39 603 32 959 35 061 35 698 34 698
LT Liab 18 647 8 256 816 1 934 3 031 DPS (ZARc) - 121.61 361.54 355.08 421.99
Tot Curr Liab 14 395 7 262 5 044 10 896 17 041 NAV PS (ZARc) 5 724.46 5 749.89 5 785.69 5 155.99 5 231.82
3 Yr Beta 1.20 0.90 0.19 0.61 1.28
PER SHARE STATISTICS (cents per share) Price High 3 766 10 004 7 802 8 248 7 807
HEPS-C (ZARc) - 2.49 2.48 7.36 5.85 Price Low 1 720 1 329 4 609 4 161 5 299
DPS (ZARc) 3.20 6.20 5.50 5.50 2.50
NAV PS (ZARc) 78.51 78.47 83.48 85.00 82.61 Price Prd End 2 623 2 053 7 292 5 294 7 503
3 Yr Beta 2.82 2.78 3.65 4.36 2.14 RATIOS
Price High 159 79 115 115 120 Ret on SH Fnd 7.40 2.07 9.51 11.57 13.81
Price Low 73 16 20 25 28 Oper Pft Mgn 11.93 6.24 11.41 12.04 12.73
Price Prd End 122 73 73 89 75 D:E 0.58 0.57 0.41 0.46 0.31
RATIOS Current Ratio 0.97 0.95 0.91 1.09 1.06
Ret on SH Fnd - 0.29 3.31 2.97 8.69 7.08 Div Cover - 1.00 1.55 1.70 1.75
Oper Pft Mgn 0.26 2.75 0.15 3.97 3.47
D:E 0.47 0.25 0.02 0.06 0.09 Textainer Group Holdings Ltd.
Current Ratio 1.58 3.16 4.63 2.28 1.45
TEX
Div Cover - 0.04 0.42 0.45 1.34 2.34 ISIN: BMG8766E1093 SHORT: TEXTAINER CODE: TXT
REG NO: EC18896 FOUNDED: 1993 LISTED: 2019
Telkom SA SOC Ltd. NATURE OF BUSINESS: Textainer has operated since 1979 and is one of the
world’slargestlessorsofintermodalcontainerswith approximately 3.8 million
TEL TEU in our owned and managed fleet. We lease containers to approximately
ISIN: ZAE000044897 SHORT: TELKOM CODE: TKG 250 customers, including all of the world’s leading international shipping lines,
REG NO: 1991/005476/30 FOUNDED: 1991 LISTED: 2003 and other lessees. Textainer's fleet consists of standard dry freight, refrigerated
NATURE OF BUSINESS: Telkom is a leading information and intermodal containers, and dry freight specials.
communications technology (ICT) services provider in South Africa.
Telkom's mission is to seamlessly connect people to a better life. Telkom SECTOR: Inds—IndsGoods & Services—IndsTransport—TransportSer
carries this through in all their brands, whether at the consumer, business NUMBER OF EMPLOYEES: 0
or wholesale level. The Telkom Foundation actively works to bridge the DIRECTORS: Brown I (ne), CottinghamDR(ne), MaccaroneJA(ne),
digital divide, with projects including the Connected Schools programme, NurekDM(ne), PedersenRD(ne), Tang G (ne), van der Merwe H R
while FutureMakers, their enterprise and supplier development initiative, (ne), Shwiel H (Chair, ne), Ghesquiere O (CEO)
empowers digital entrepreneurs to realise their vision. MAJOR ORDINARY SHAREHOLDERS as at 31 Dec 2019
SECTOR: Telecoms—Telecoms—TelecomServiceProvider—TelecomServices Coronation Asset Management (Pty) Ltd. 11.80%
NUMBER OF EMPLOYEES: 15 296 Isam Kabbani 6.50%
DIRECTORS: Kapila N (ind ne), LuthuliPCS(ind ne), Moloko S (ind ne), Trencor Ltd. 5.30%
Mzondeki K (ind ne), Petersen-Cook F (ind ne), RaynerKA(ind ne), MORE INFO: www.sharedata.co.za/sdo/jse/TXT
Samuels A (ne), Sibisi DrSP(ind ne), Singh E (ind ne), Tomlinson R G COMPANY SECRETARY: Adam Hopkin
(ind ne), von ZeunerLL(ind ne), Maseko S N (Group CE), Reyneke D TRANSFER SECRETARY: Computershare Investor Services (Pty) Ltd.
(CFO) SPONSOR: Investec Bank Ltd.
MAJOR ORDINARY SHAREHOLDERS as at 31 Mar 2020 AUDITORS: KPMG LLP
The Government of the Republic of South Africa 40.51% CAPITAL STRUCTURE AUTHORISED ISSUED
Government Employees Pension Fund 14.97% TXT Ords USD0.01 ea 140 000 000 58 032 164
Telkom Treasury Stock 2.61%
POSTAL ADDRESS: Private Bag X881, Pretoria, 0001 LIQUIDITY: Apr21 Ave 315 893 shares p.w., R65.8m(28.3% p.a.)
MORE INFO: www.sharedata.co.za/sdo/jse/TKG ALSH 40 Week MA TEXTAINER
COMPANY SECRETARY: Ayanda Ceba
42700
TRANSFER SECRETARY: Computershare Investor Services (Pty) Ltd.
SPONSOR: Nedbank CIB
AUDITORS: PwC Inc., SizweNtsalubaGobodo Inc. 36285
CAPITAL STRUCTURE AUTHORISED ISSUED 29871
TKG Ords of R10.00 ea 1 000 000 000 511 140 239
23456
DISTRIBUTIONS [ZARc]
Ords of R10.00 ea Ldt Pay Amt 17042
Final No 26 7 Jul 20 13 Jul 20 50.08
Interim No 25 26 Nov 19 2 Dec 19 71.53 2020 | 10627
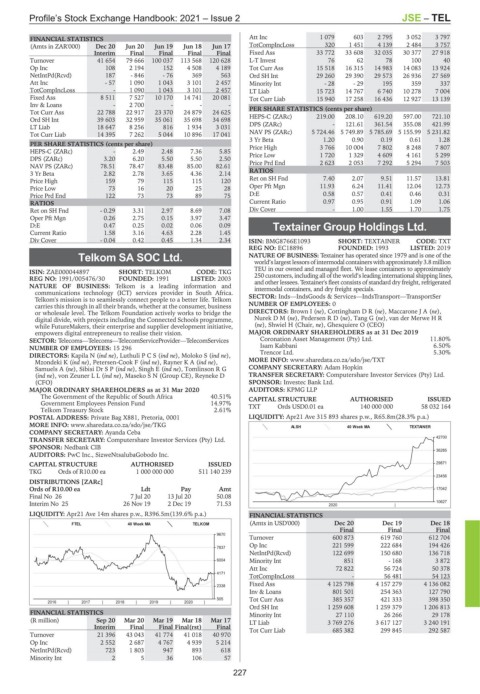
LIQUIDITY: Apr21 Ave 14m shares p.w., R396.5m(139.6% p.a.) FINANCIAL STATISTICS
FTEL 40 Week MA TELKOM (Amts in USD'000) Dec 20 Dec 19 Dec 18
Final Final Final
9670
Turnover 600 873 619 760 612 704
Op Inc 221 599 222 684 194 426
7837
NetIntPd(Rcvd) 122 699 150 680 136 718
6004 Minority Int 851 - 168 3 872
Att Inc 72 822 56 724 50 378
4171
TotCompIncLoss - 56 481 54 123
Fixed Ass 4 125 798 4 157 279 4 136 082
2338
Inv & Loans 801 501 254 363 127 790
505 Tot Curr Ass 385 357 421 333 398 350
2016 | 2017 | 2018 | 2019 | 2020 |
Ord SH Int 1 259 608 1 259 379 1 206 813
FINANCIAL STATISTICS Minority Int 27 110 26 266 29 178
(R million) Sep 20 Mar 20 Mar 19 Mar 18 Mar 17 LT Liab 3 769 276 3 617 127 3 240 191
Interim Final Final Final(rst) Final
Turnover 21 396 43 043 41 774 41 018 40 970 Tot Curr Liab 685 382 299 845 292 587
Op Inc 2 552 2 687 4 767 4 939 5 214
NetIntPd(Rcvd) 723 1 803 947 893 618
Minority Int 2 5 36 106 57
227