
Page 30 - Profile's Stock Exchange Handbook - 2021 Issue 3
P. 30
NSX – CMB Profile’s Stock Exchange Handbook: 2021 – Issue 3
FINANCIAL STATISTICS PER SHARE STATISTICS (cents per share)
(Amts in AUD'000) Dec 20 Jun 20 Jun 19 Jun 18 Jun 17 DPS (ZARc) - - - 316.54 -
Interim Final Final Final Final
Op Inc - 1 087 - 2 315 - 2 401 - 2 509 - 2 996 NAV PS (ZARc) 68.63 - 78.08 174.27 164.93 - 166.57 -
- 0.62
3 Yr Beta
0.51
NetIntPd(Rcvd) - - - 146 - 31 - 41 Price High 191 178 173 145 158
Minority Int - 11 - 41 - 24 - 32 - 9 Price Low 72 112 - 115 124
Att Inc - 1 076 - 2 274 - 2 231 - 2 446 - 2 687 Price Prd End 74 178 145 118 134
TotCompIncLoss 1 329 - - 786 - 3 348 2 231
Fixed Ass 64 61 128 127 149 RATIOS - 12.73 - 149.42 5.16 6.95 - 4.68
Ret on SH Fnd
Tot Curr Ass 3 121 4 259 6 458 8 492 3 531
Ord SH Int 53 381 51 676 63 280 63 070 58 107 Oper Pft Mgn - 43.48 - 399.41 18.95 23.59 - 24.93
D:E
0.01
0.03
0.02
0.05
0.07
Minority Int 21 52 - 315 - 294 - 260
LT Liab 273 263 297 474 440 Current Ratio 3.67 4.82 10.32 4.62 10.37
Tot Curr Liab 375 284 225 310 291 Div Cover - - - 0.04 -
PER SHARE STATISTICS (cents per share)
HEPS-C (ZARc) - - - 2.23 - 2.89 - 3.41 Capricorn Group Ltd.
NAV PS (ZARc) 56.44 58.02 60.13 74.65 76.74 CGP
CODE: CGP
3 Yr Beta 1.19 0.91 2.46 1.97 - ISIN: NA000A1T6SV9 SHORT: CAP GROUP LISTED: 2013
FOUNDED: 1996
REG NO: 96/300
Price High 38 682 4 849 76 64 - NATURE OF BUSINESS: Capricorn Group is a leading Namibian-owned
Price Low 35 18 35 27 - financial services group listed on the NSX. We have three banking
Price Prd End 106 40 45 55 - subsidiaries operating in Namibia, Botswana and Zambia, with other
RATIOS subsidiaries and associates providing adjacent and complementary
Ret on SH Fnd - 4.07 - 4.48 - 3.58 - 3.95 - 4.66 products and services. Our customers range from personal to corporate,
D:E 0.01 0.01 - 0.01 0.01 small and medium enterprises. Our value proposition is built around
Current Ratio 8.32 15.00 28.70 27.39 12.13 customers rather than products or channels. We apply data and digital
technology in transactionalbanking services, products andfunctionality to
address future customer needs.
Bravura Holdings Ltd. SECTOR: Fins—Banks—Banks—Banks
NUMBER OF EMPLOYEES: 2 359
CMB
ISIN: MU0496N00003 SHORT: BRAVURA CODE: CMB DIRECTORS: Gaomab IIHM(ne), Menetté G (ind ne),
REG NO: C132144 C1/GBL FOUNDED: 2015 LISTED: 2015 Reyneke D (ind ne), Solomon E (ind ne), Esterhuyse J J (FD),
NATURE OF BUSINESS: Bravura Holdings Ltd. (formerly CMB BrandtJC(ne), Swanepoel J J (Chair, ne), FourieDG(ld ind ne),
International Ltd.) has a unique approach to financial services investment. Prinsloo M J (Group CE), Nakazibwe-Sekandi G (ind ne)
AsaMauritian-incorporatedentity,thecompanyholdsaCategory 1Global MAJOR ORDINARY SHAREHOLDERS as at 30 Jun 2020
Business Licence issued by the Financial Services Commission (FSC). The Capricorn Investment Holdings Ltd. 43.10%
company has a primary listing on the Official List of the Stock Exchange of Government Institutions Pension Fund 25.90%
Mauritius (SEM), and a secondary listing on the Main Board of the Nam-mic Financial Services Holdings (Pty) Ltd. 8.00%
Namibian Stock Exchange (NSX). POSTAL ADDRESS: PO Box 15, Windhoek, Namibia
SECTOR: Fins—FinServcs—InvBnkng&BrokerServcs—Investment Services MORE INFO: www.sharedata.co.za/sdo/jse/CGP
NUMBER OF EMPLOYEES: 0 COMPANY SECRETARY: H G von Ludwiger
DIRECTORS: du Plessis A D, GujadhurUK(ind ne, Mau), Hay S M, TRANSFER SECRETARY: Transfer Secretaries (Pty) Ltd.
Lim Voon KeeYS(ne), PadayachyKP(ind ne), SPONSOR: PSG Konsult Wealth Management (Namibia)
Taposeea R (Chair, ind ne, Mau) AUDITORS: PwC Inc.
MAJOR ORDINARY SHAREHOLDERS as at 31 Mar 2020
CMB Investment Ltd. 44.56% CAPITAL STRUCTURE AUTHORISED ISSUED
African Rainbow Capital Financial Services 29.90% CGP Ords NAD2.5c ea 600 000 000 519 184 399
Titan Rand (Pty) Ltd. 13.80% DISTRIBUTIONS [NADc]
POSTAL ADDRESS: Level 3, Alexander House, 35 Cybercity, Ebène, Ords NAD2.5c ea Ldt Pay Amt
Mauritius, 72201 Interim No 15 12 Mar 21 31 Mar 21 22.00
MORE INFO: www.sharedata.co.za/sdo/jse/CMB Final No 14 9 Oct 20 30 Oct 20 20.00
COMPANY SECRETARY: Intercontinental Trust Ltd.
SPONSOR: PSG Wealth Management Namibia (Pty) Ltd. LIQUIDITY: Jul21 Ave 64 829 shares p.w., R85.5m(0.6% p.a.)
AUDITORS: KPMG ALSH 40 Week MA CAP GROUP
CAPITAL STRUCTURE AUTHORISED ISSUED 2277
CMB Ords no par val - 345 983 575
DISTRIBUTIONS [USDc] 2022
Ords no par val Ldt Pay Amt
1766
Final No 1 26 Jun 18 29 Jun 18 0.23
1511
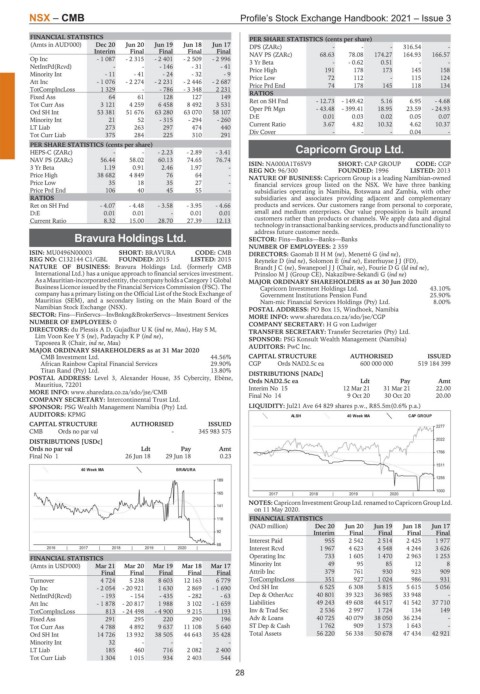
40 Week MA BRAVURA
1255
189
1000
165 2017 | 2018 | 2019 | 2020 |
NOTES: Capricorn Investment Group Ltd. renamed to Capricorn Group Ltd.
141
on 11 May 2020.
116 FINANCIAL STATISTICS
(NAD million) Dec 20 Jun 20 Jun 19 Jun 18 Jun 17
92 Interim Final Final Final Final
Interest Paid 955 2 542 2 514 2 425 1 977
68
2016 | 2017 | 2018 | 2019 | 2020 | Interest Rcvd 1 967 4 623 4 548 4 244 3 626
FINANCIAL STATISTICS Operating Inc 733 1 605 1 470 2 963 1 253
(Amts in USD'000) Mar 21 Mar 20 Mar 19 Mar 18 Mar 17 Minority Int 49 95 85 12 8
Final Final Final Final Final Attrib Inc 379 761 930 923 909
Turnover 4 724 5 238 8 603 12 163 6 779 TotCompIncLoss 351 927 1 024 986 931
Op Inc - 2 054 - 20 921 1 630 2 869 - 1 690 Ord SH Int 6 525 6 308 5 815 5 615 5 056
NetIntPd(Rcvd) - 193 - 154 - 435 - 282 - 63 Dep & OtherAcc 40 801 39 323 36 985 33 948 -
Att Inc - 1 878 - 20 817 1 988 3 102 - 1 659 Liabilities 49 243 49 608 44 517 41 542 37 710
TotCompIncLoss 813 - 24 498 - 4 900 9 215 1 193 Inv & Trad Sec 2 536 2 997 1 724 134 149
Fixed Ass 291 295 220 290 196 Adv & Loans 40 725 40 079 38 050 36 234 -
Tot Curr Ass 4 788 4 892 9 637 11 108 5 640 ST Dep & Cash 1 762 909 1 573 1 643 -
Ord SH Int 14 726 13 932 38 505 44 643 35 428 Total Assets 56 220 56 338 50 678 47 434 42 921
Minority Int 32 - - - -
LT Liab 185 460 716 2 082 2 400
Tot Curr Liab 1 304 1 015 934 2 403 544
28