
Page 7 - 2021 Issue 2
P. 7
Profile’s Stock Exchange Handbook: 2021 – Issue 2 About the Stock Exchange Handbook
HEPLU-C: Headline Earnings per Linked Unit NAV: Net Asset Value
from continued operations – used for loan stock (P): Pro-forma financials
companies where shares are linked to a debt P/E: Ratio of Price to Earnings (12-month rolling
instrument (see HEPS-C)
HEPS-C)
HEPS-C: Headline Earnings per Share from PEG: Price/Earnings Growth ratio
continuedoperations–Earnings(profits)pershare
excluding the effects of exceptional items and (rst): Restated result
discontinued operations. Scr/100: The number of shares a shareholder can
Hline Erngs-CO: Headline earnings from continuing elect to receive per one hundred ordinary share
operations. held instead of a cash dividend.
Ldt: Last day to trade (to qualify for dividends or Tr 5yr av grwth %: Trailing five year average
other corporate action) growth (ie, average of five years to that point)
Ldr: Last day to register (to qualify for dividends or TRI: Total Return Index (ie, price performance
other corporate action) includingreinvestmentofdividends/distributions)
Liquidity: The three figures shown are (i) the Volatility: Standard deviation of month-on-month
average number of shares traded per week, (ii) the percentage price change over 36 months
average value of shares traded per week, and (iii) ZAR: South African rands
the percentage of issued shares traded over the last ZARc: South African cents
year. (ii) is based on the latest share price available
before going to print. (iii) is annualised where full Note: All financial statements are presented in
year data is not available. accordance with International Financial Reporting
Standards (IFRS) unless otherwise stated.
Market Cap: Market Capitalisation (calculated as
total number of outstanding shares multiplied by
share price)
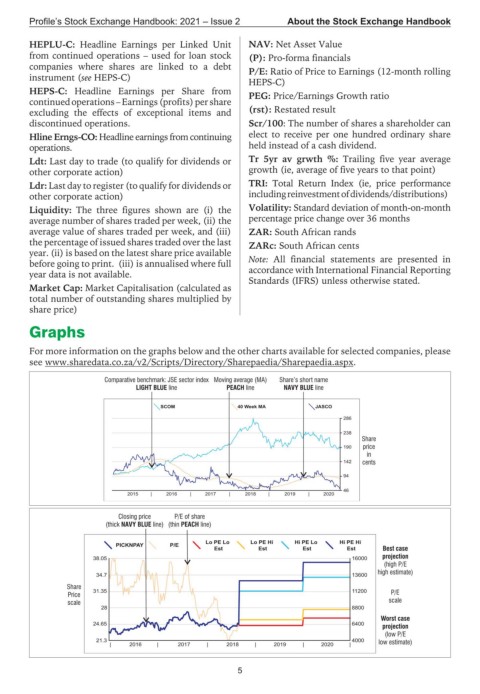
Graphs
For more information on the graphs below and the other charts available for selected companies, please
see www.sharedata.co.za/v2/Scripts/Directory/Sharepaedia/Sharepaedia.aspx.
Comparative benchmark: JSE sector index Moving average (MA) Share’s short name
LIGHT BLUE line PEACH line NAVY BLUE line
SCOM 40 Week MA JASCO
286
238
Share
190 price
in
142 cents
94
46
2015 | 2016 | 2017 | 2018 | 2019 | 2020
Closing price P/E of share
(thick NAVY BLUE line) (thin PEACH line)
Lo PE Lo Lo PE Hi Hi PE Lo Hi PE Hi
PICKNPAY P/E
Est Est Est Est Best case
projection
38.05 16000
(high P/E
high estimate)
34.7 13600
Share
31.35 11200 P/E
Price
scale scale
28 8800
Worst case
24.65 6400
projection
(low P/E
21.3 4000 low estimate)
| 2016 | 2017 | 2018 | 2019 | 2020 |
5